

Carbon Energy Tracking
Measuring and tracking low carbon energy usage in a university involves several steps to understand the institution's energy consumption, identify areas for improvement, and set targets for reducing carbon emissions. LPU is consistently monitoring and improving low carbon energy tracking efforts, and making meaningful progress toward reducing its carbon footprint and contributing to a more sustainable future. The University's dedication to adhering to guidelines aligns with the United Nations' sustainable development objectives. It is noteworthy that in 2018, the University installed a rooftop solar PV plant with a capacity of 1.1 MW. Presently, the university boasts a total installed solar power capacity of 7.5 MW.
| Sr. No. | Month | Solar 100 kW power generation (in kWh) | Solar 01 MW power generation (in kWh) | Solar 2.097 MW power generation (in kWh) |
|---|---|---|---|---|
| 1 | Jan-24 | 4124 | 35906 | 42949 |
| 2 | Feb-24 | 7497 | 62520 | 101468 |
| 3 | Mar-24 | 10449 | 316179 | 186348 |
| 4 | April.2024 | 11370 | 48755 | 259749 |
| 5 | May.2024 | 12405 | 167301 | 244170 |
| 6 | June.2024 | 10022 | 105273 | 251959 |
| 7 | July.2024 | 9772 | 92348 | 246605 |
| 8 | Aug.2024 | 10865 | 108190 | 229595 |
| 9 | Sept.2024 | 10074 | 102388 | 205426 |
| 10 | Oct.2024 | 6492 | - | 187918 |
| 11 | Nov.2024 | 8005 | 111325 | 92486 |
| 12 | Dec.2024 | 5659 | - | 84830 |
Total Energy generated/consumed from solar panel = 3390422 kWh
A gigajoule (GJ) is the equivalent to 1 billion joules. A joule is a measure of the energy required to send an electrical current of one ampere through a resistance of one ohm for one second. One GJ is equal to 277.8 kilowatt hours (kWh), 1.055 million British thermal units (Btu) or 0.17 barrels of oil.
Total Energy generated/consumed from solar panel = 12205 Gigajoule
Total Energy generated/consumed from solar panel = 12205 Gigajoule
BIOGAS PLANT
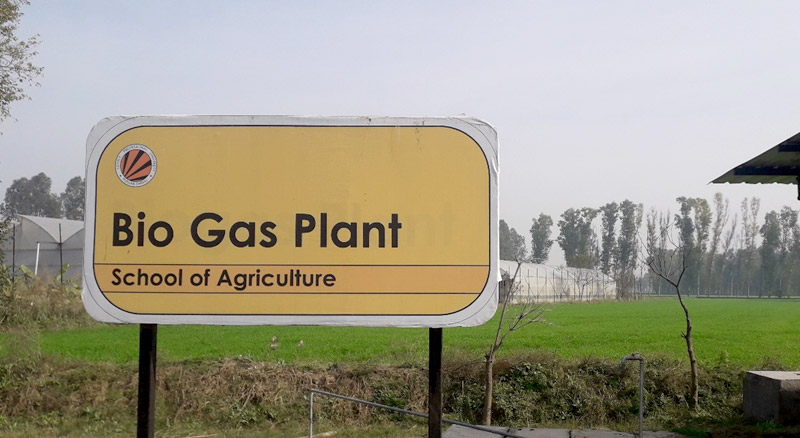
Biogas plant
A biogas plant based on ‘Deenbandhu model’ is constructed to produce biogas from cattle dung. To reduce greenhouse gas emissions and the risk of pollution to waterways, organic waste can be removed and used to produce biogas, a renewable source of energy. Biogas contains roughly 50- 70% methane, 30-40% carbon dioxide, and trace amounts of other gases. The University currently has 3 cubic meter operating biogas systems across the campus to process kitchen waste. Apart from the cattle dung, sewer waste is also fed into the plant to produce biogas.
Not only has the university lowered the total power use from the conventional resources, but it has also boosted the university’s renewable generation. From the graph below it was observed that the percentage of Energy Produced from low carbon resources with respect to the total energy production is increasing from the previous years.
Not only has the university lowered the total power use from the conventional resources, but it has also boosted the university’s renewable generation. From the graph below it was observed that the percentage of Energy Produced from low carbon resources with respect to the total energy production is increasing from the previous years.
ENERGY TRACKING FROM LOW CARBON SOURCES
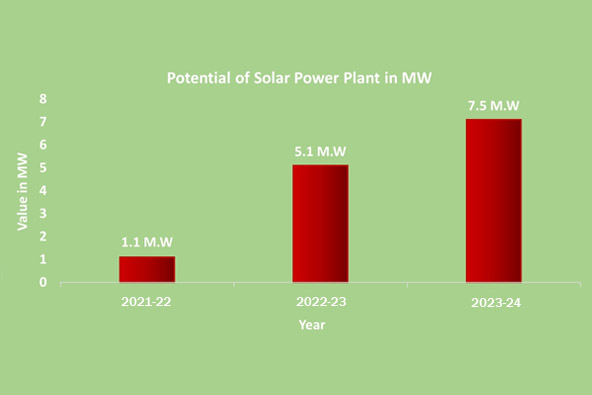
Potential of solar power Plant in MW
The transition toward low-carbon energy sources has shown a consistent upward trend from 2021 to 2024. In 2021, energy production from low-carbon sources was 1.1 MW, marking the modest beginnings of a sustainable energy mix. By 2022, this capacity had grown substantially to 5.1 MW, reflecting enhanced investment and commitment to cleaner technologies. The momentum continued in 2023 with a further rise to 7.5 MW. In 2024, this positive trajectory persisted, with the solar plant maintaining a potential of 7.5 MW, reinforcing the institution’s dedication to renewable energy adoption and environmental sustainability.
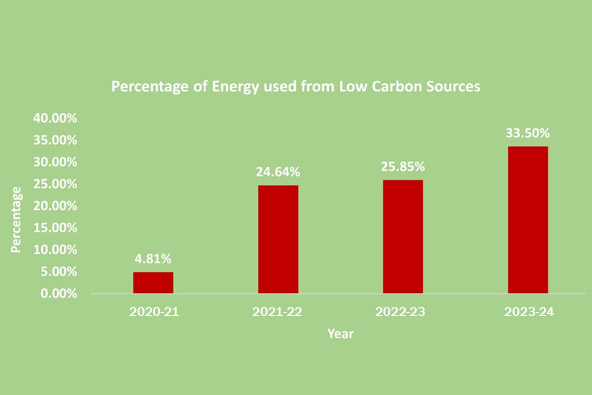
Energy used from Low carbon Sources
The share of energy generated from low-carbon sources has shown remarkable growth from 2020 to 2024. In 2020, these sources accounted for only 4.81% of total energy generation. By 2021, this share rose significantly to 24.64%, marking a major shift toward cleaner energy alternatives. The positive momentum continued in 2022, with low-carbon sources contributing 25.85%, and further increased to 33.55% in 2023. In 2024, the contribution reached an impressive 43.1%, underscoring a strong and sustained commitment to reducing carbon emissions. This steady upward trajectory reflects a clear dedication to sustainable, environmentally responsible energy production and signifies meaningful progress toward a greener energy future.
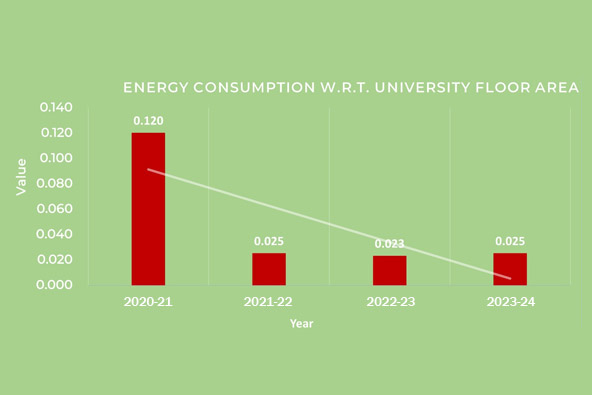
Energy Consumption
Lovely Professional University has demonstrated remarkable progress in energy efficiency, as reflected in the steady decline of energy consumption per unit of floor area over recent years. In 2021, consumption stood at 0.025 units per square meter, marking a significant improvement. The downward trend continued in 2022, reaching 0.023, highlighting ongoing efforts toward sustainability. Although a slight rise to 0.025 was observed in 2023—and maintained in 2024—the overall reduction signifies the effectiveness of the university’s initiatives, including enhanced insulation, upgraded HVAC systems, and the increased adoption of renewable energy sources.
CREATING RAIN WATER HARVESTING TRENCHES:
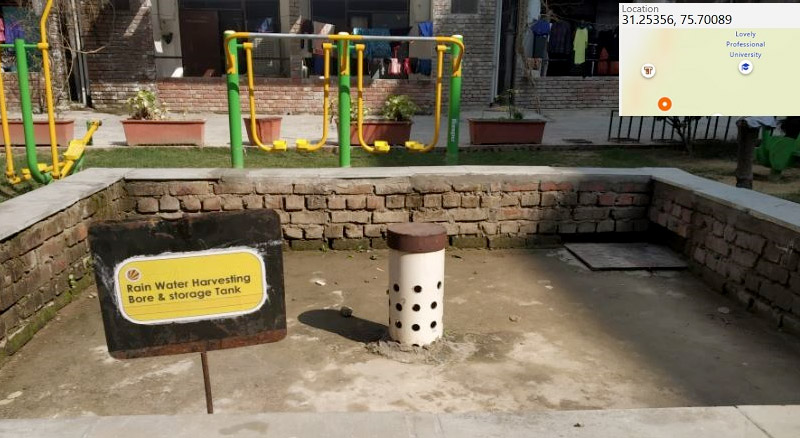
Rain Water Harvesting
In order to raise the water table in the Lovely Professional University, there are more than 35 Rain water harvesting Tanks for rain water harvest from roads, walkways, roof terrace, road sides etc. In addition, there are trenches/chambers by the roadside with piping system so that the rain water can be trapped to Rain Water harvesting tanks through these trenches which are inter-connected with each other.
RECYCLING OF SEWAGE WATER:
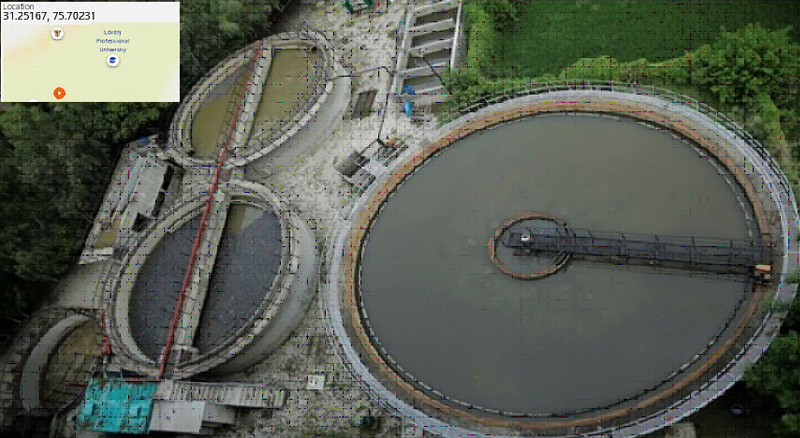
STP plants
For sewerage treatment there are there STP plants i.e. one 5 MLD [Mega Liters per Day] and two of 10KLD, in the campus and the entire treated water is then used for Horticulture and agriculture. The sludge obtained is composed and used as manure in horticulture.
NIRF
 Report of NIRF Data Capturing System: Management
- Report of NIRF Data Capturing System: Pharmacy
- Report of NIRF Data Capturing System: Engineering
- Report of NIRF Data Capturing System: Overall
- Report of NIRF Data Capturing System: Law
- Report of NIRF Data Capturing System: Architecture
- Report of NIRF Data Capturing System: Innovation
- Report of NIRF Data Capturing System: Agriculture
- Report of SDG Institution
- Report of NIRF Data Capturing System: Management
- Report of NIRF Data Capturing System: Pharmacy
- Report of NIRF Data Capturing System: Engineering
- Report of NIRF Data Capturing System: Overall
- Report of NIRF Data Capturing System: Law
- Report of NIRF Data Capturing System: Architecture
- Report of NIRF Data Capturing System: Agriculture